.png)
The Dashboard tab is your tab view of a space. It shows widgets and charts that summarise what's happening inside the space, so you can answer "how are we doing?" without opening a single task. By the end of this guide, you'll know what each built-in widget shows, how to filter the dashboard by date range, and when to use the dashboard in your weekly routine.
What you'll need
- Access to at least one Space.
- Ideally, some tasks already in the space — an empty dashboard tells you nothing.
Open the Dashboard tab
The dashboard is the first tab in every Space.

Click the Dashboard tab. The dashboard loads and displays the widgets configured for the Space.
Built-in widgets
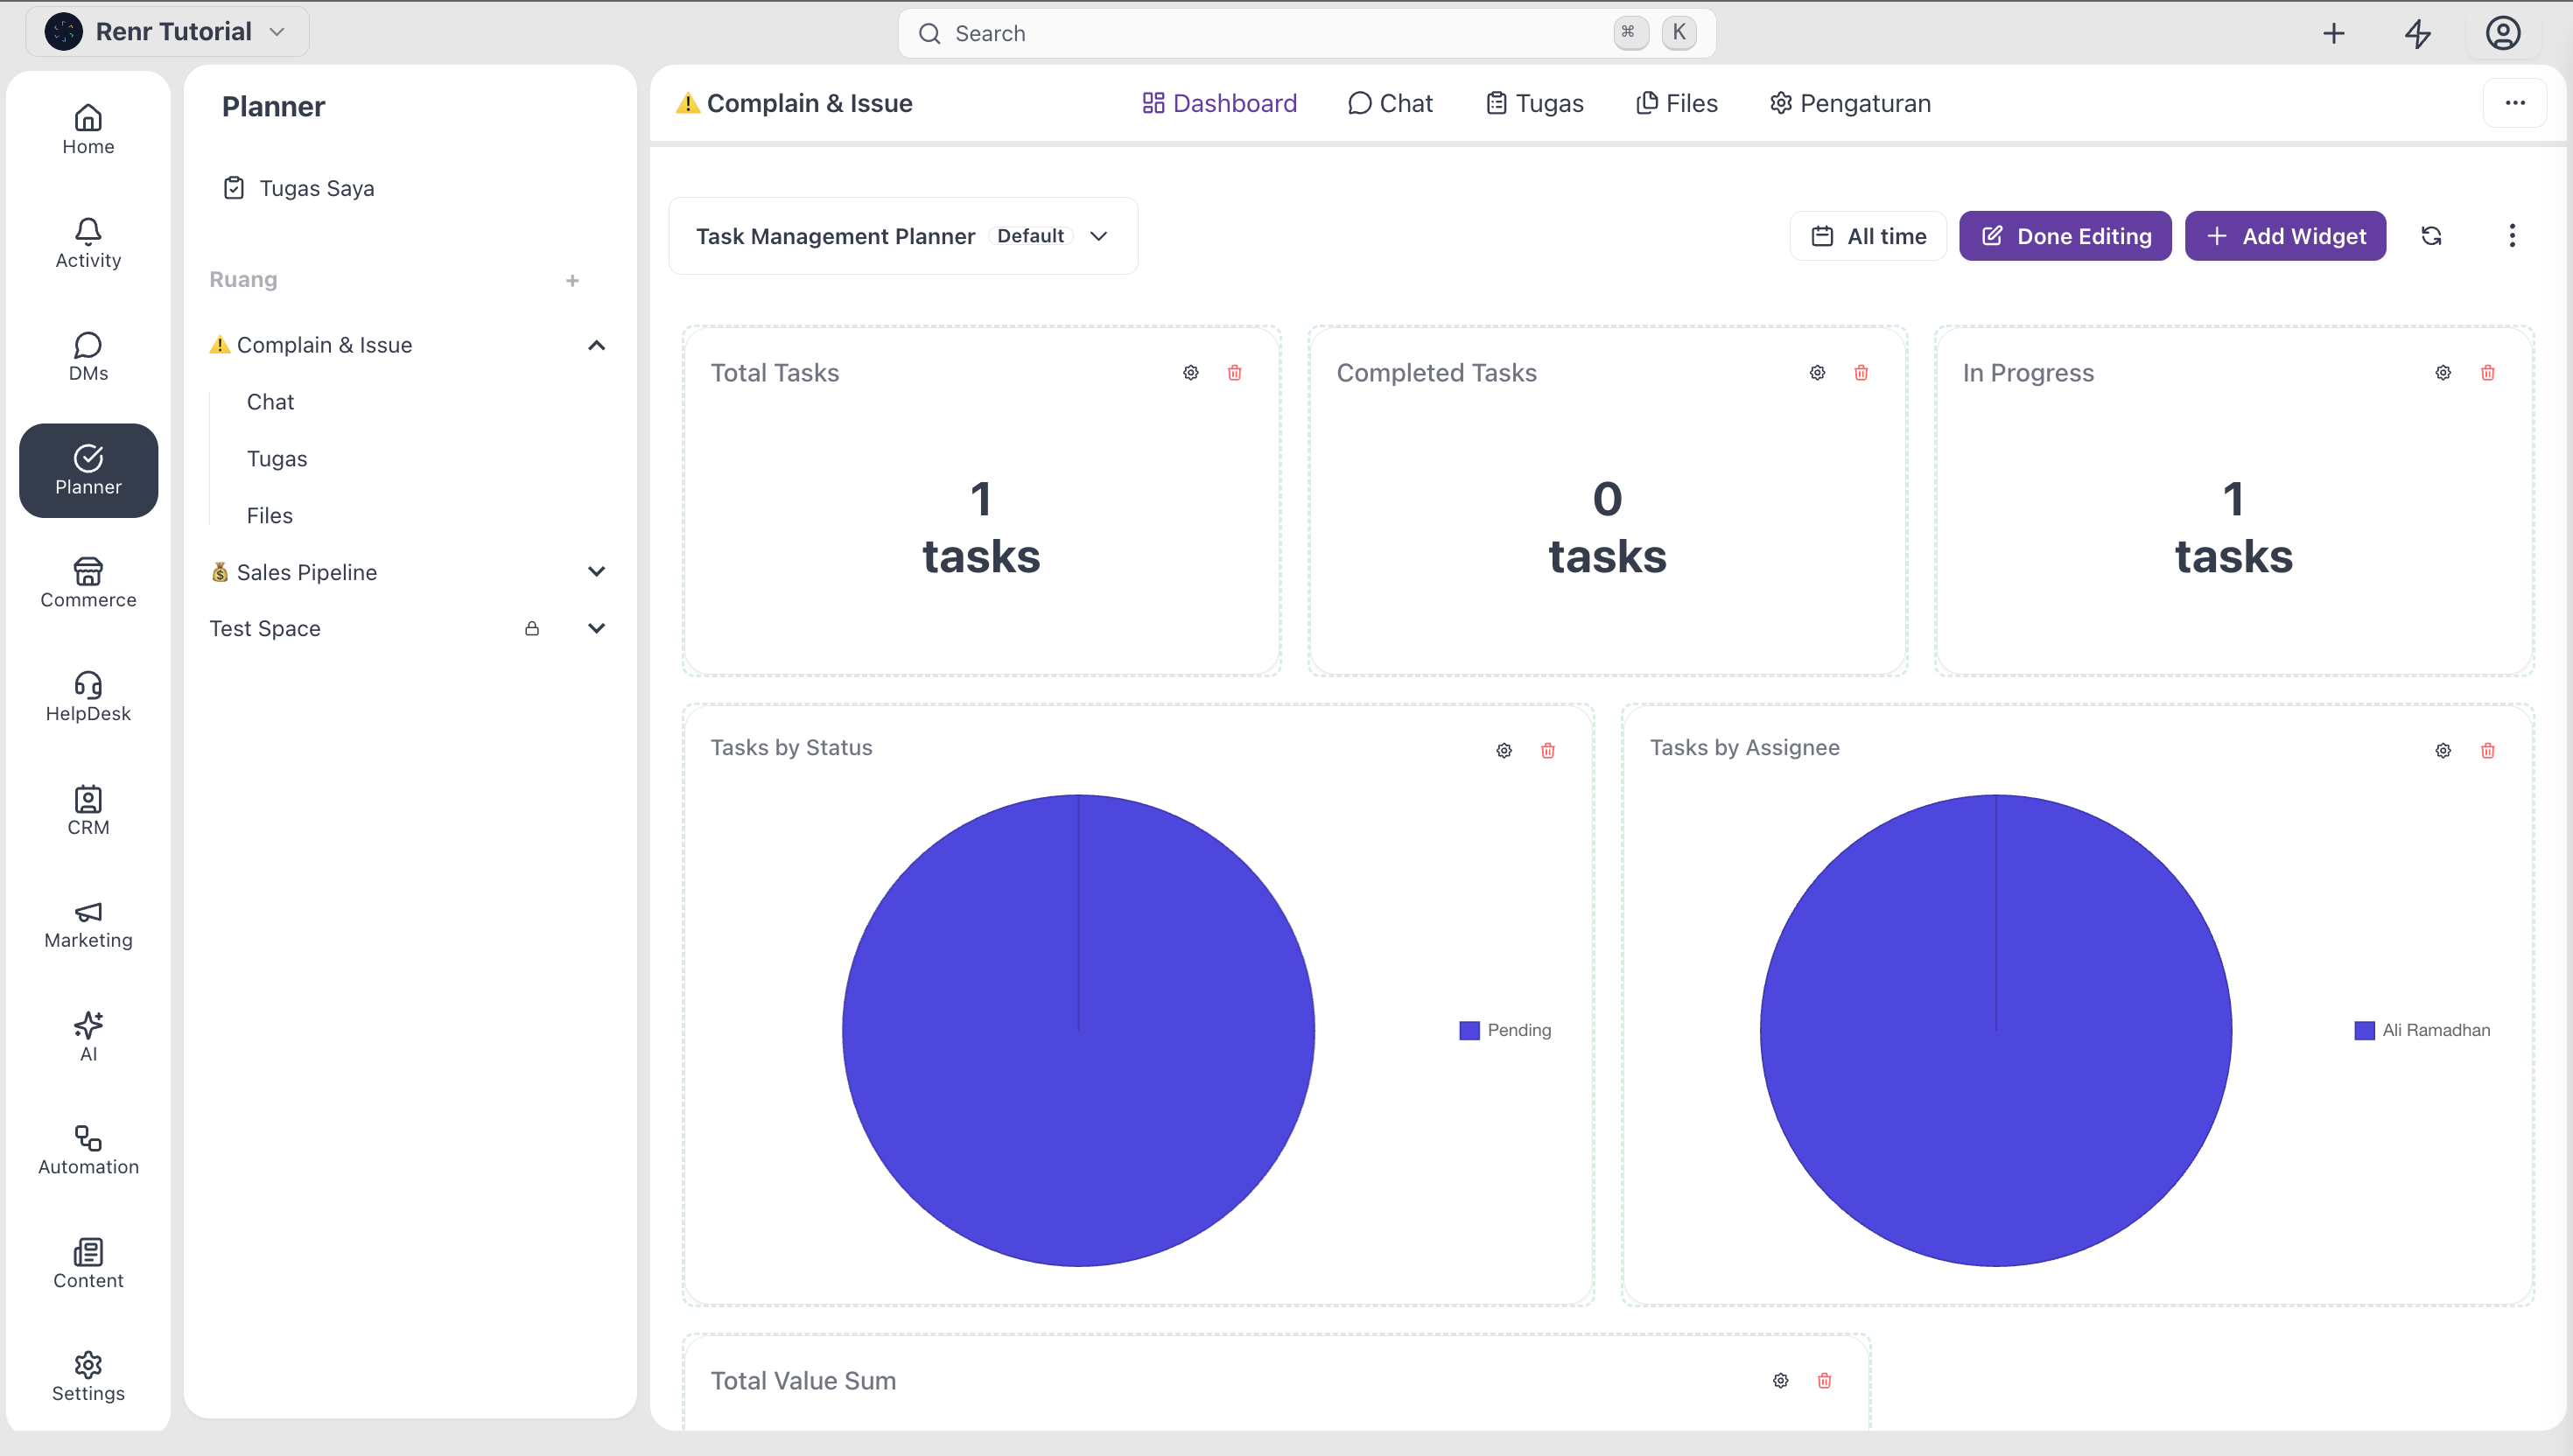
A new space with six built-in widgets — three charts and three counters. Each one answers a single question about the space, and every widget responds to the date range selector at the top of the Dashboard.
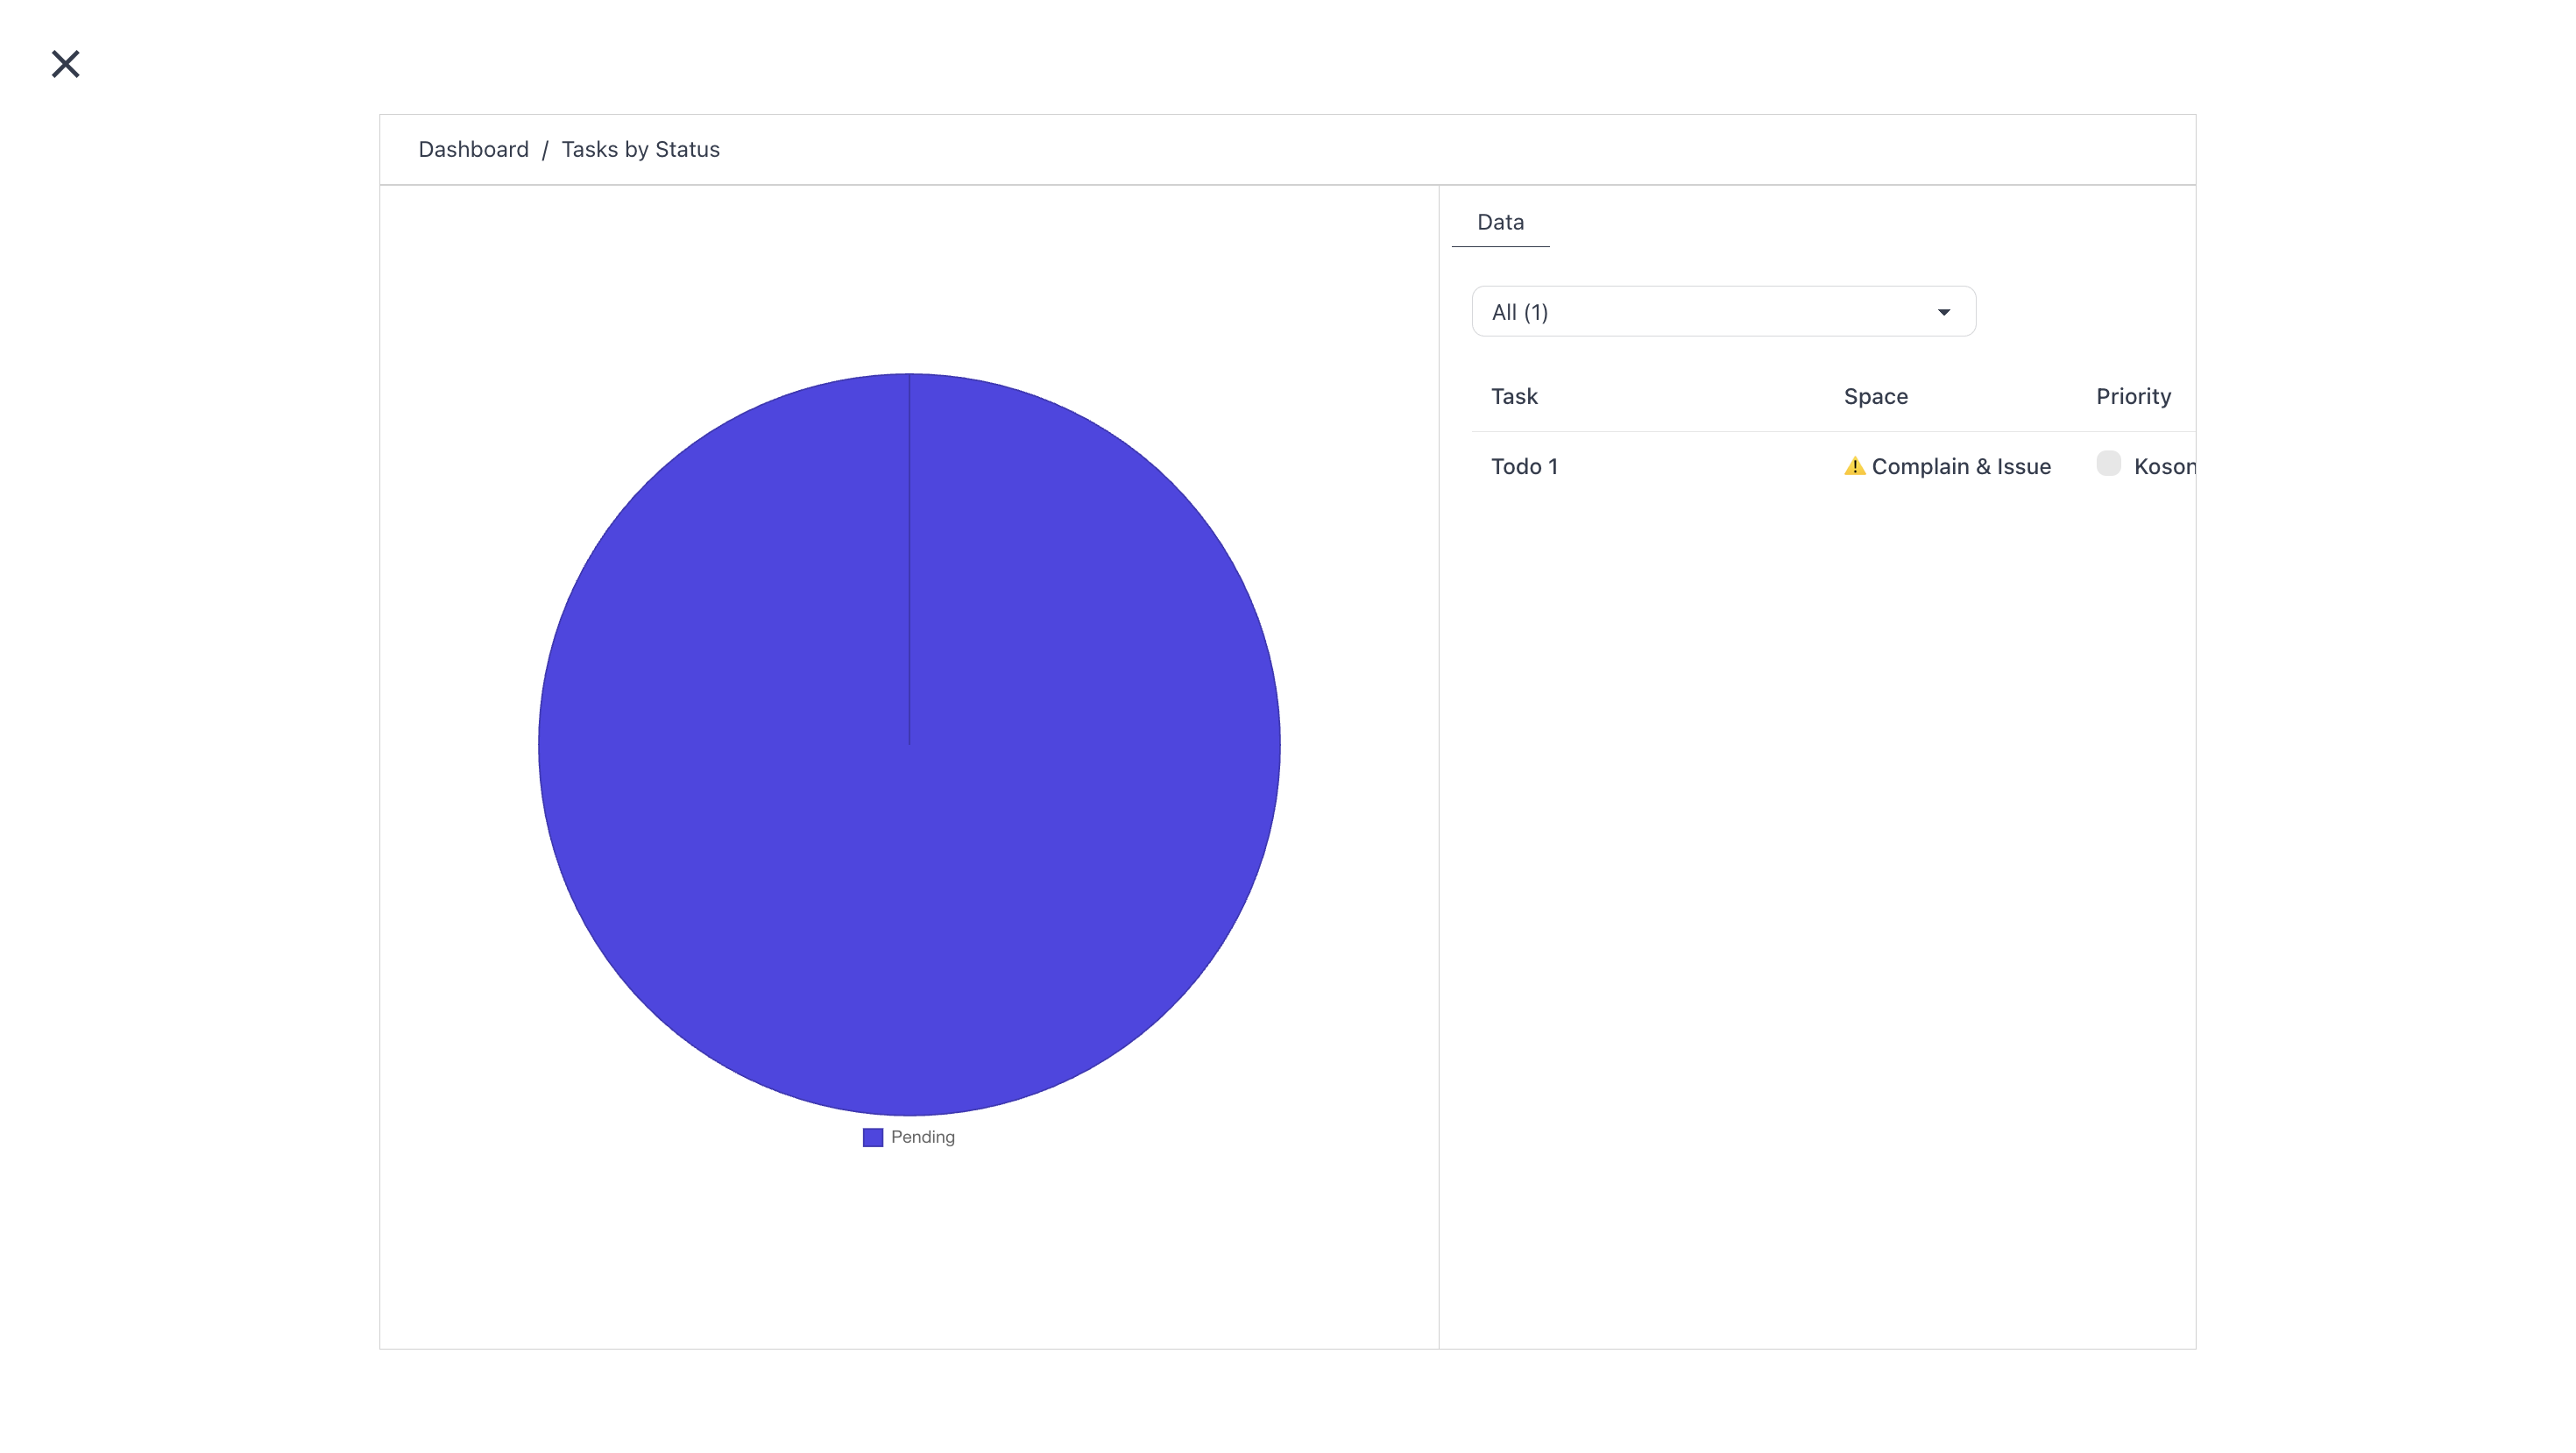
Task by Status (pie chart)
A pie chart showing how the space's tasks are distributed across statuses. Each slice is a status : To Do, In Progress, Review, Done, and any custom statuses your team has added—sized by how many tasks sit in it.
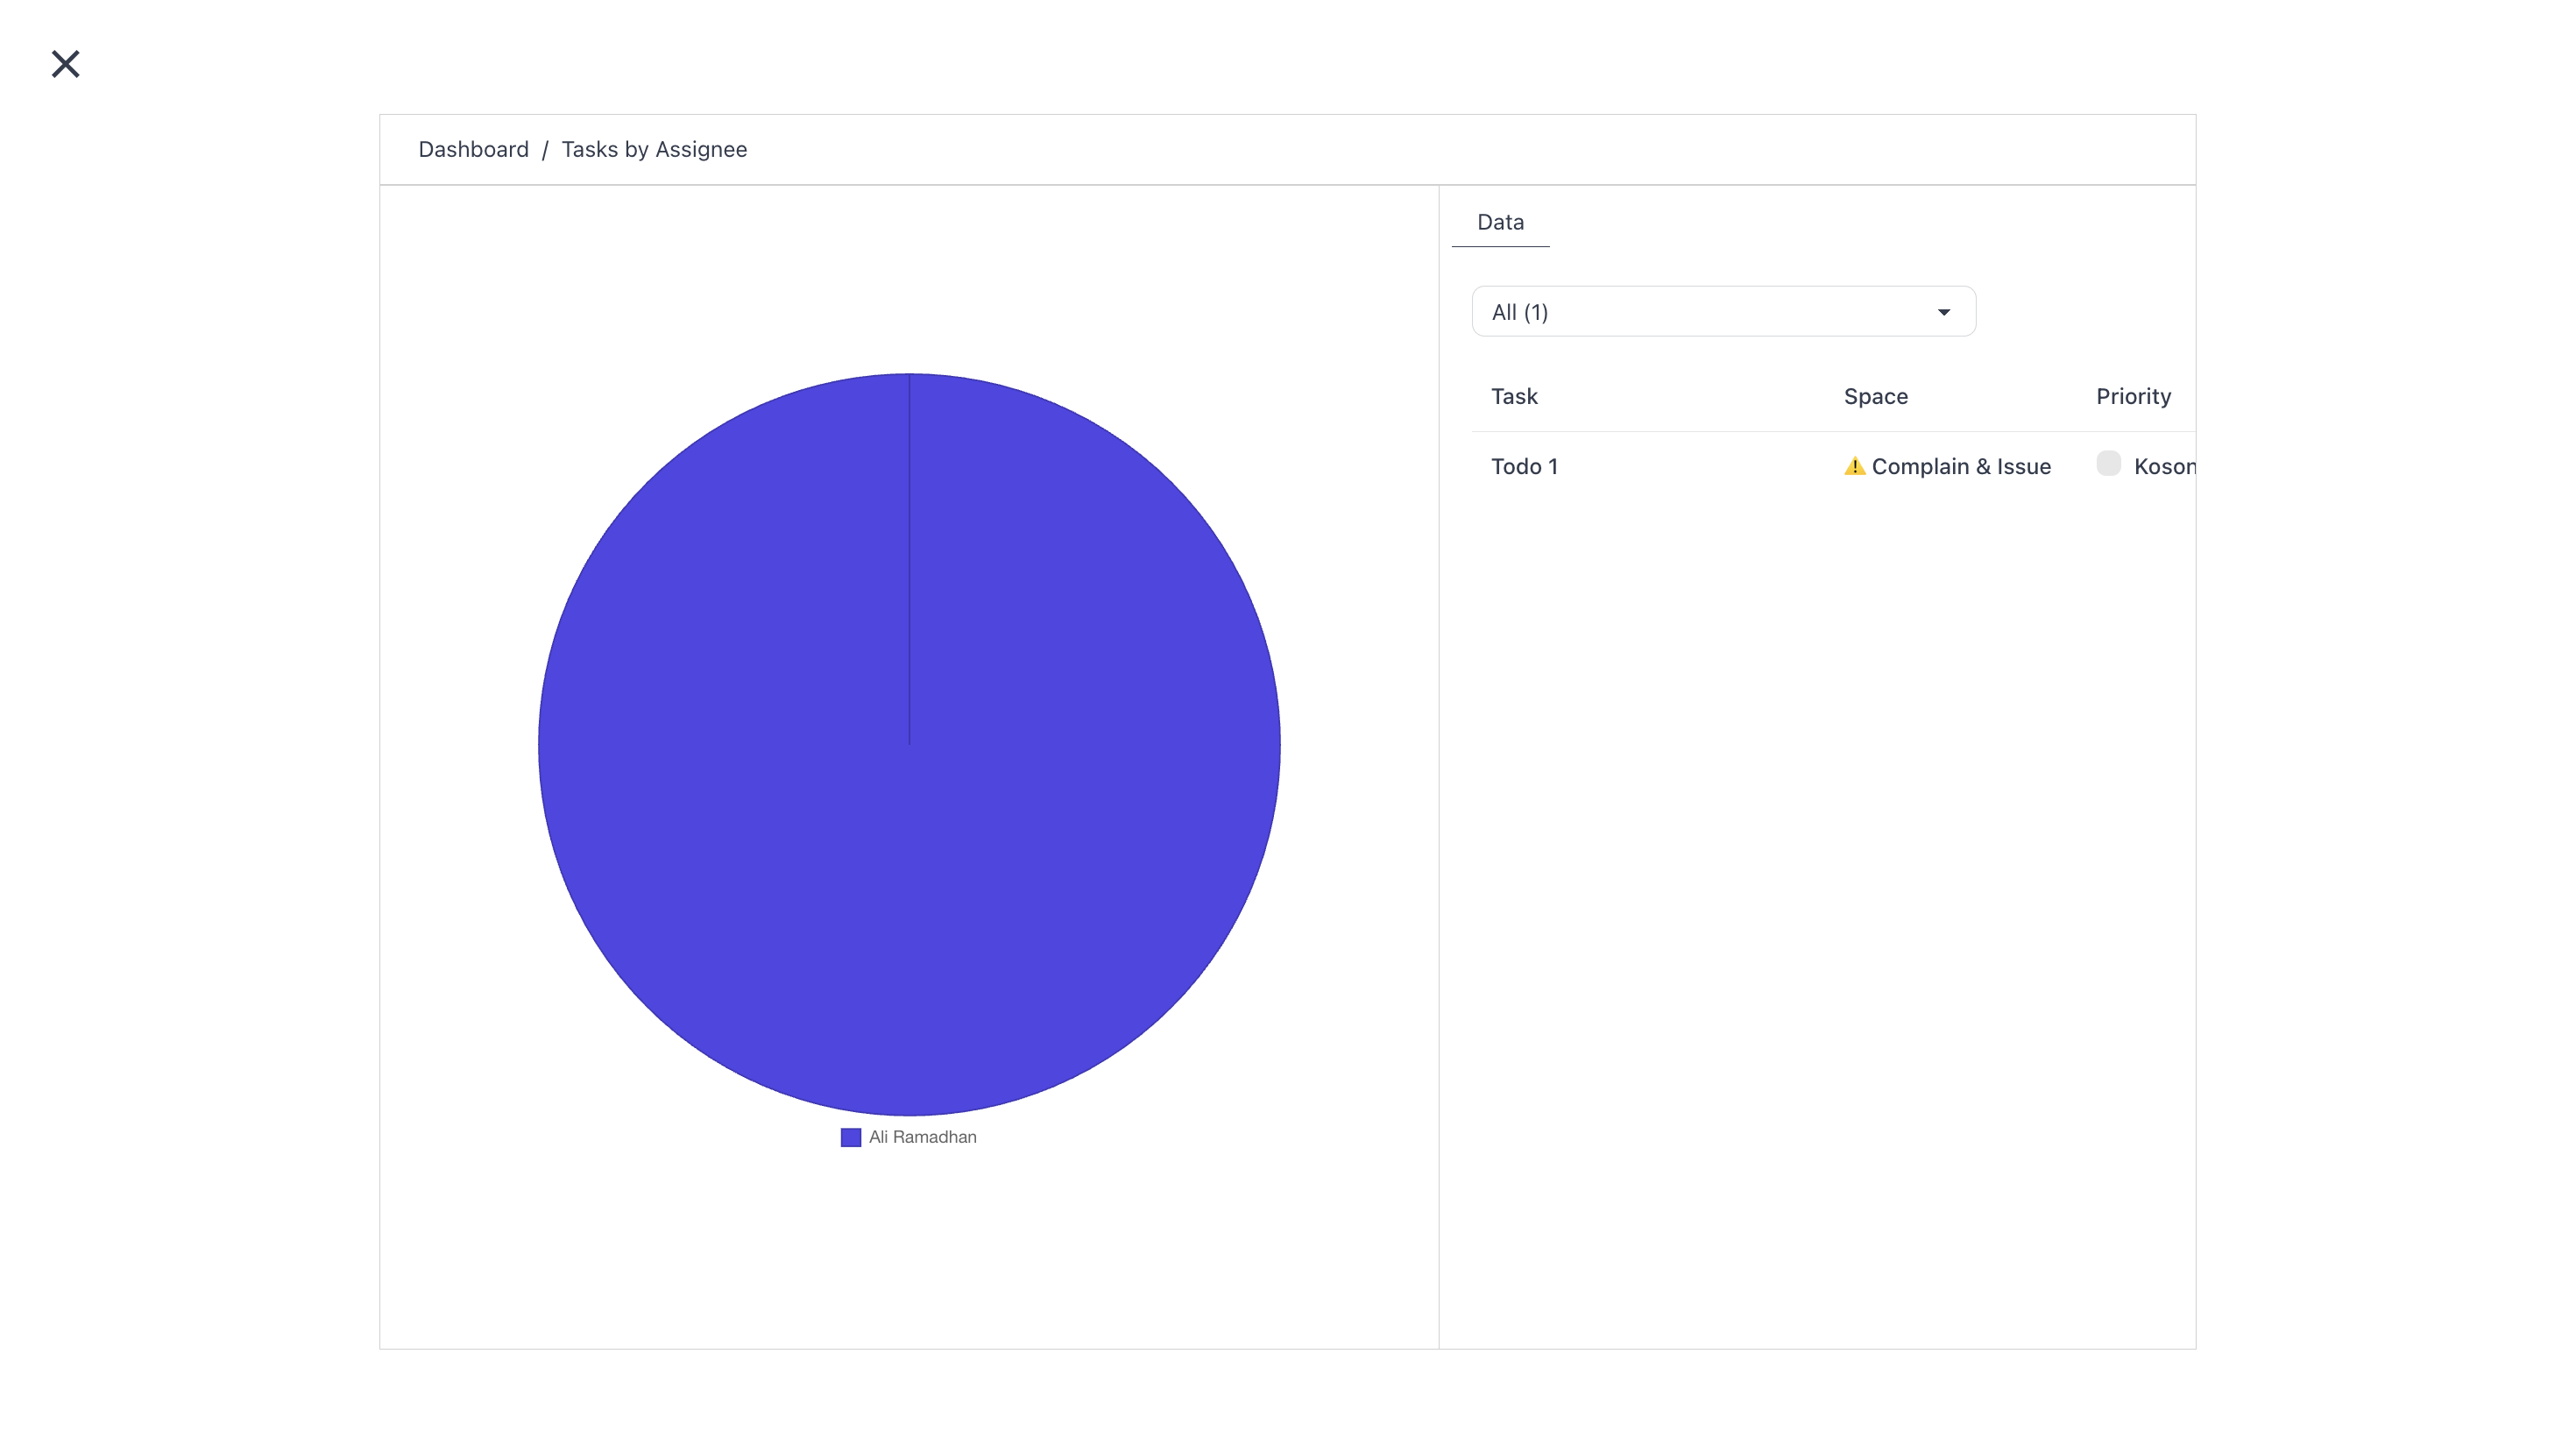
Task by Assignee (pie chart)
A pie chart showing how the space's tasks are distributed across teammates. Each slice is one assignee, sized by their task count. A near-even pie is a balanced team; a single dominant slice means one person is carrying too much.
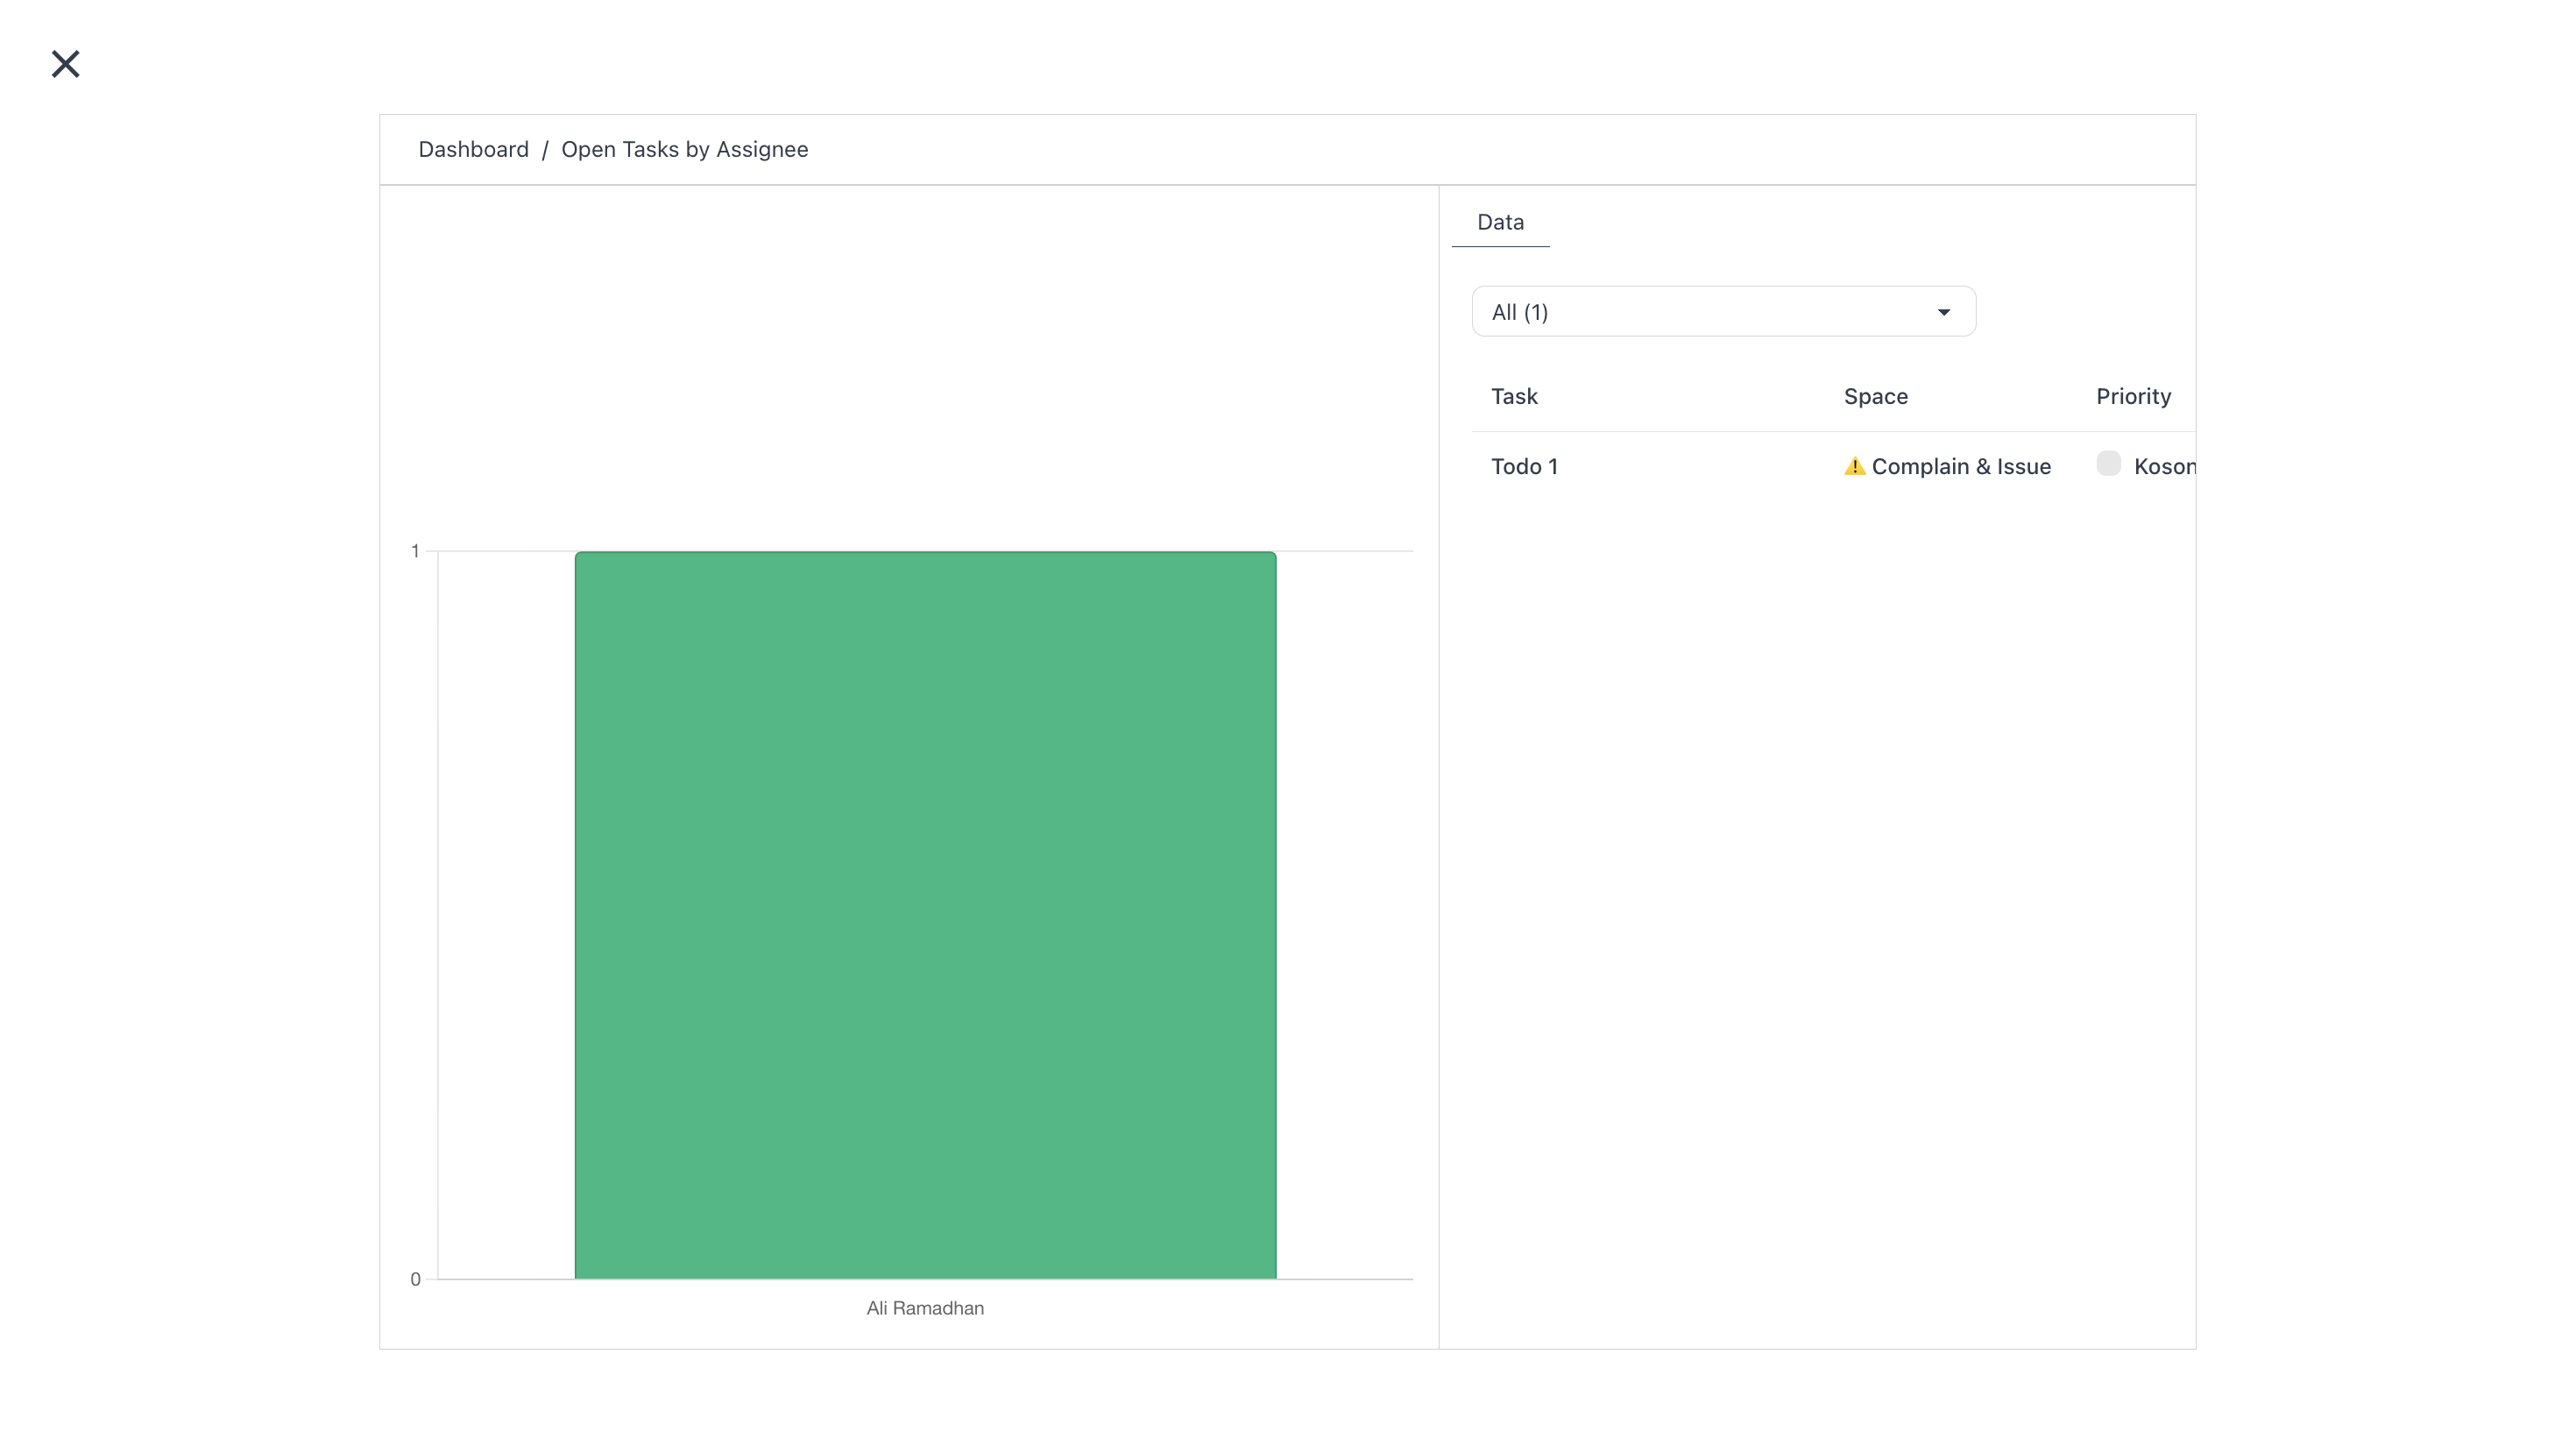
Task by Assignee (bar chart)
The same data as the pie chart above, drawn as side-by-side bars instead of slices. Bars are easier to scan when you have many teammates or want to compare exact numbers between two specific people. Use the pie for quick visual balance; use the bar for ranking and comparison.
Total Task Counter
A counter showing the total number of tasks in the space, regardless of status. The "how many task is this space?" number is useful for sizing the workload and tracking how the space grows over time.
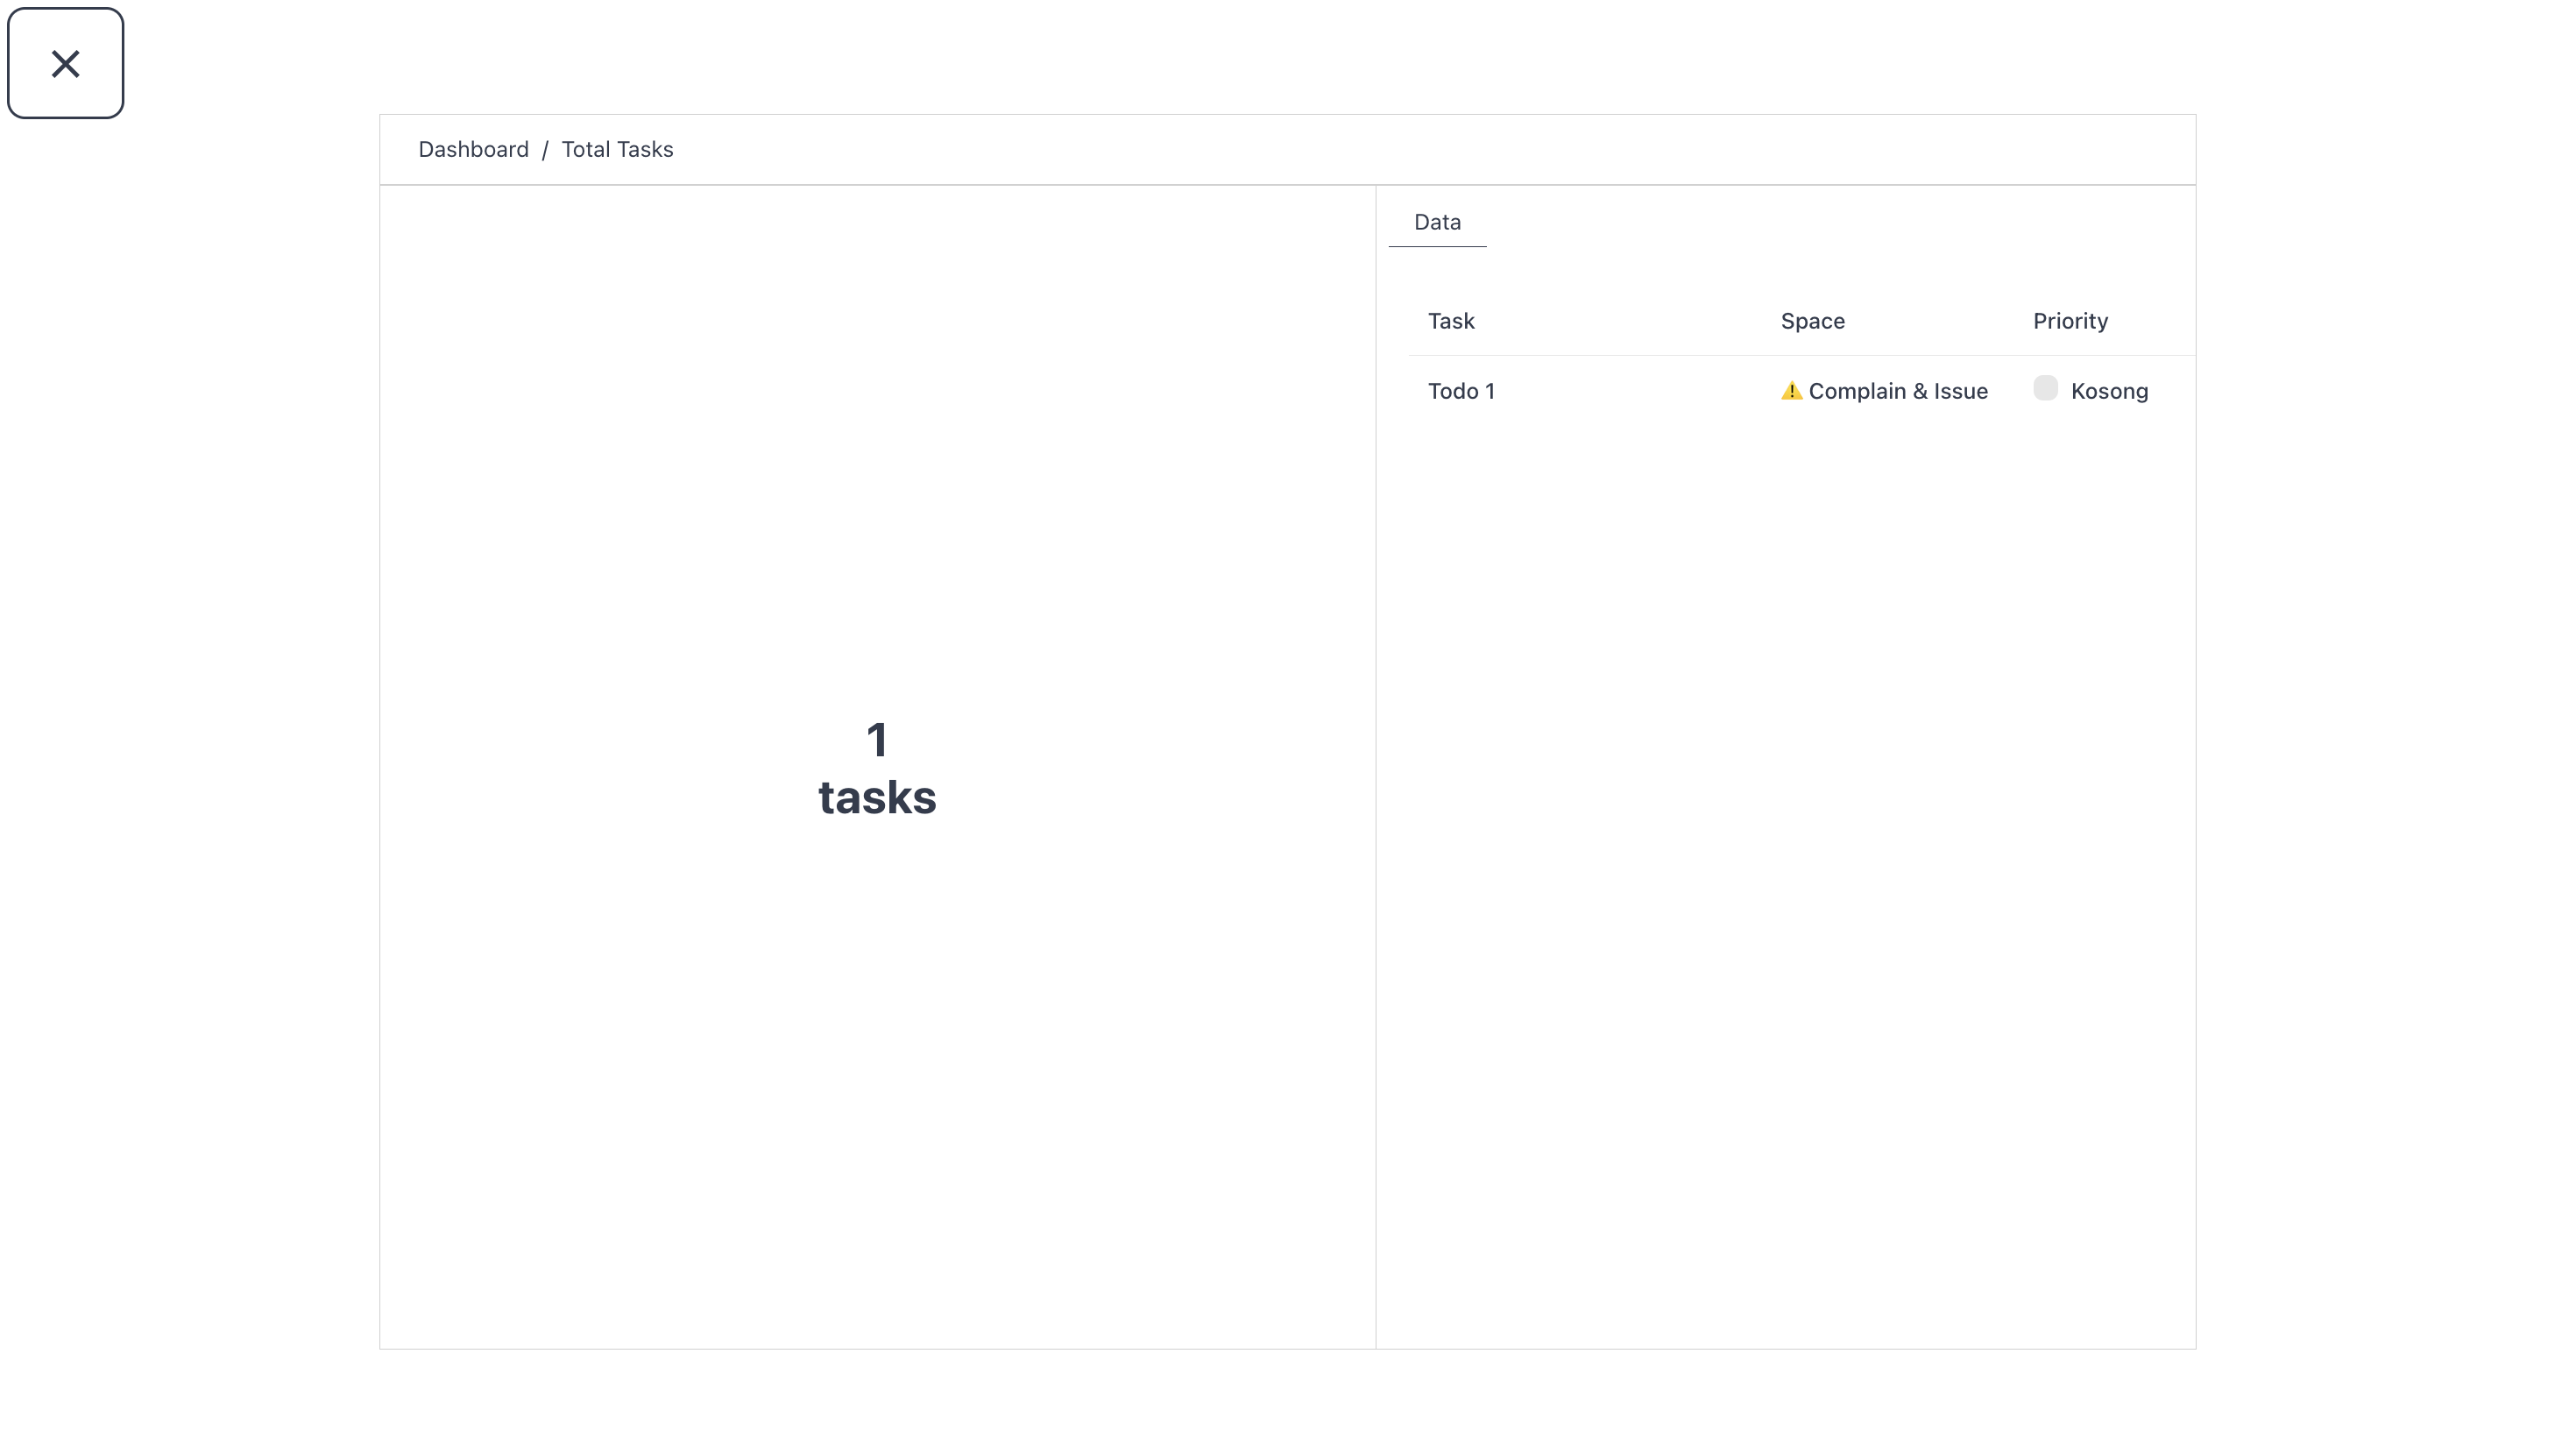
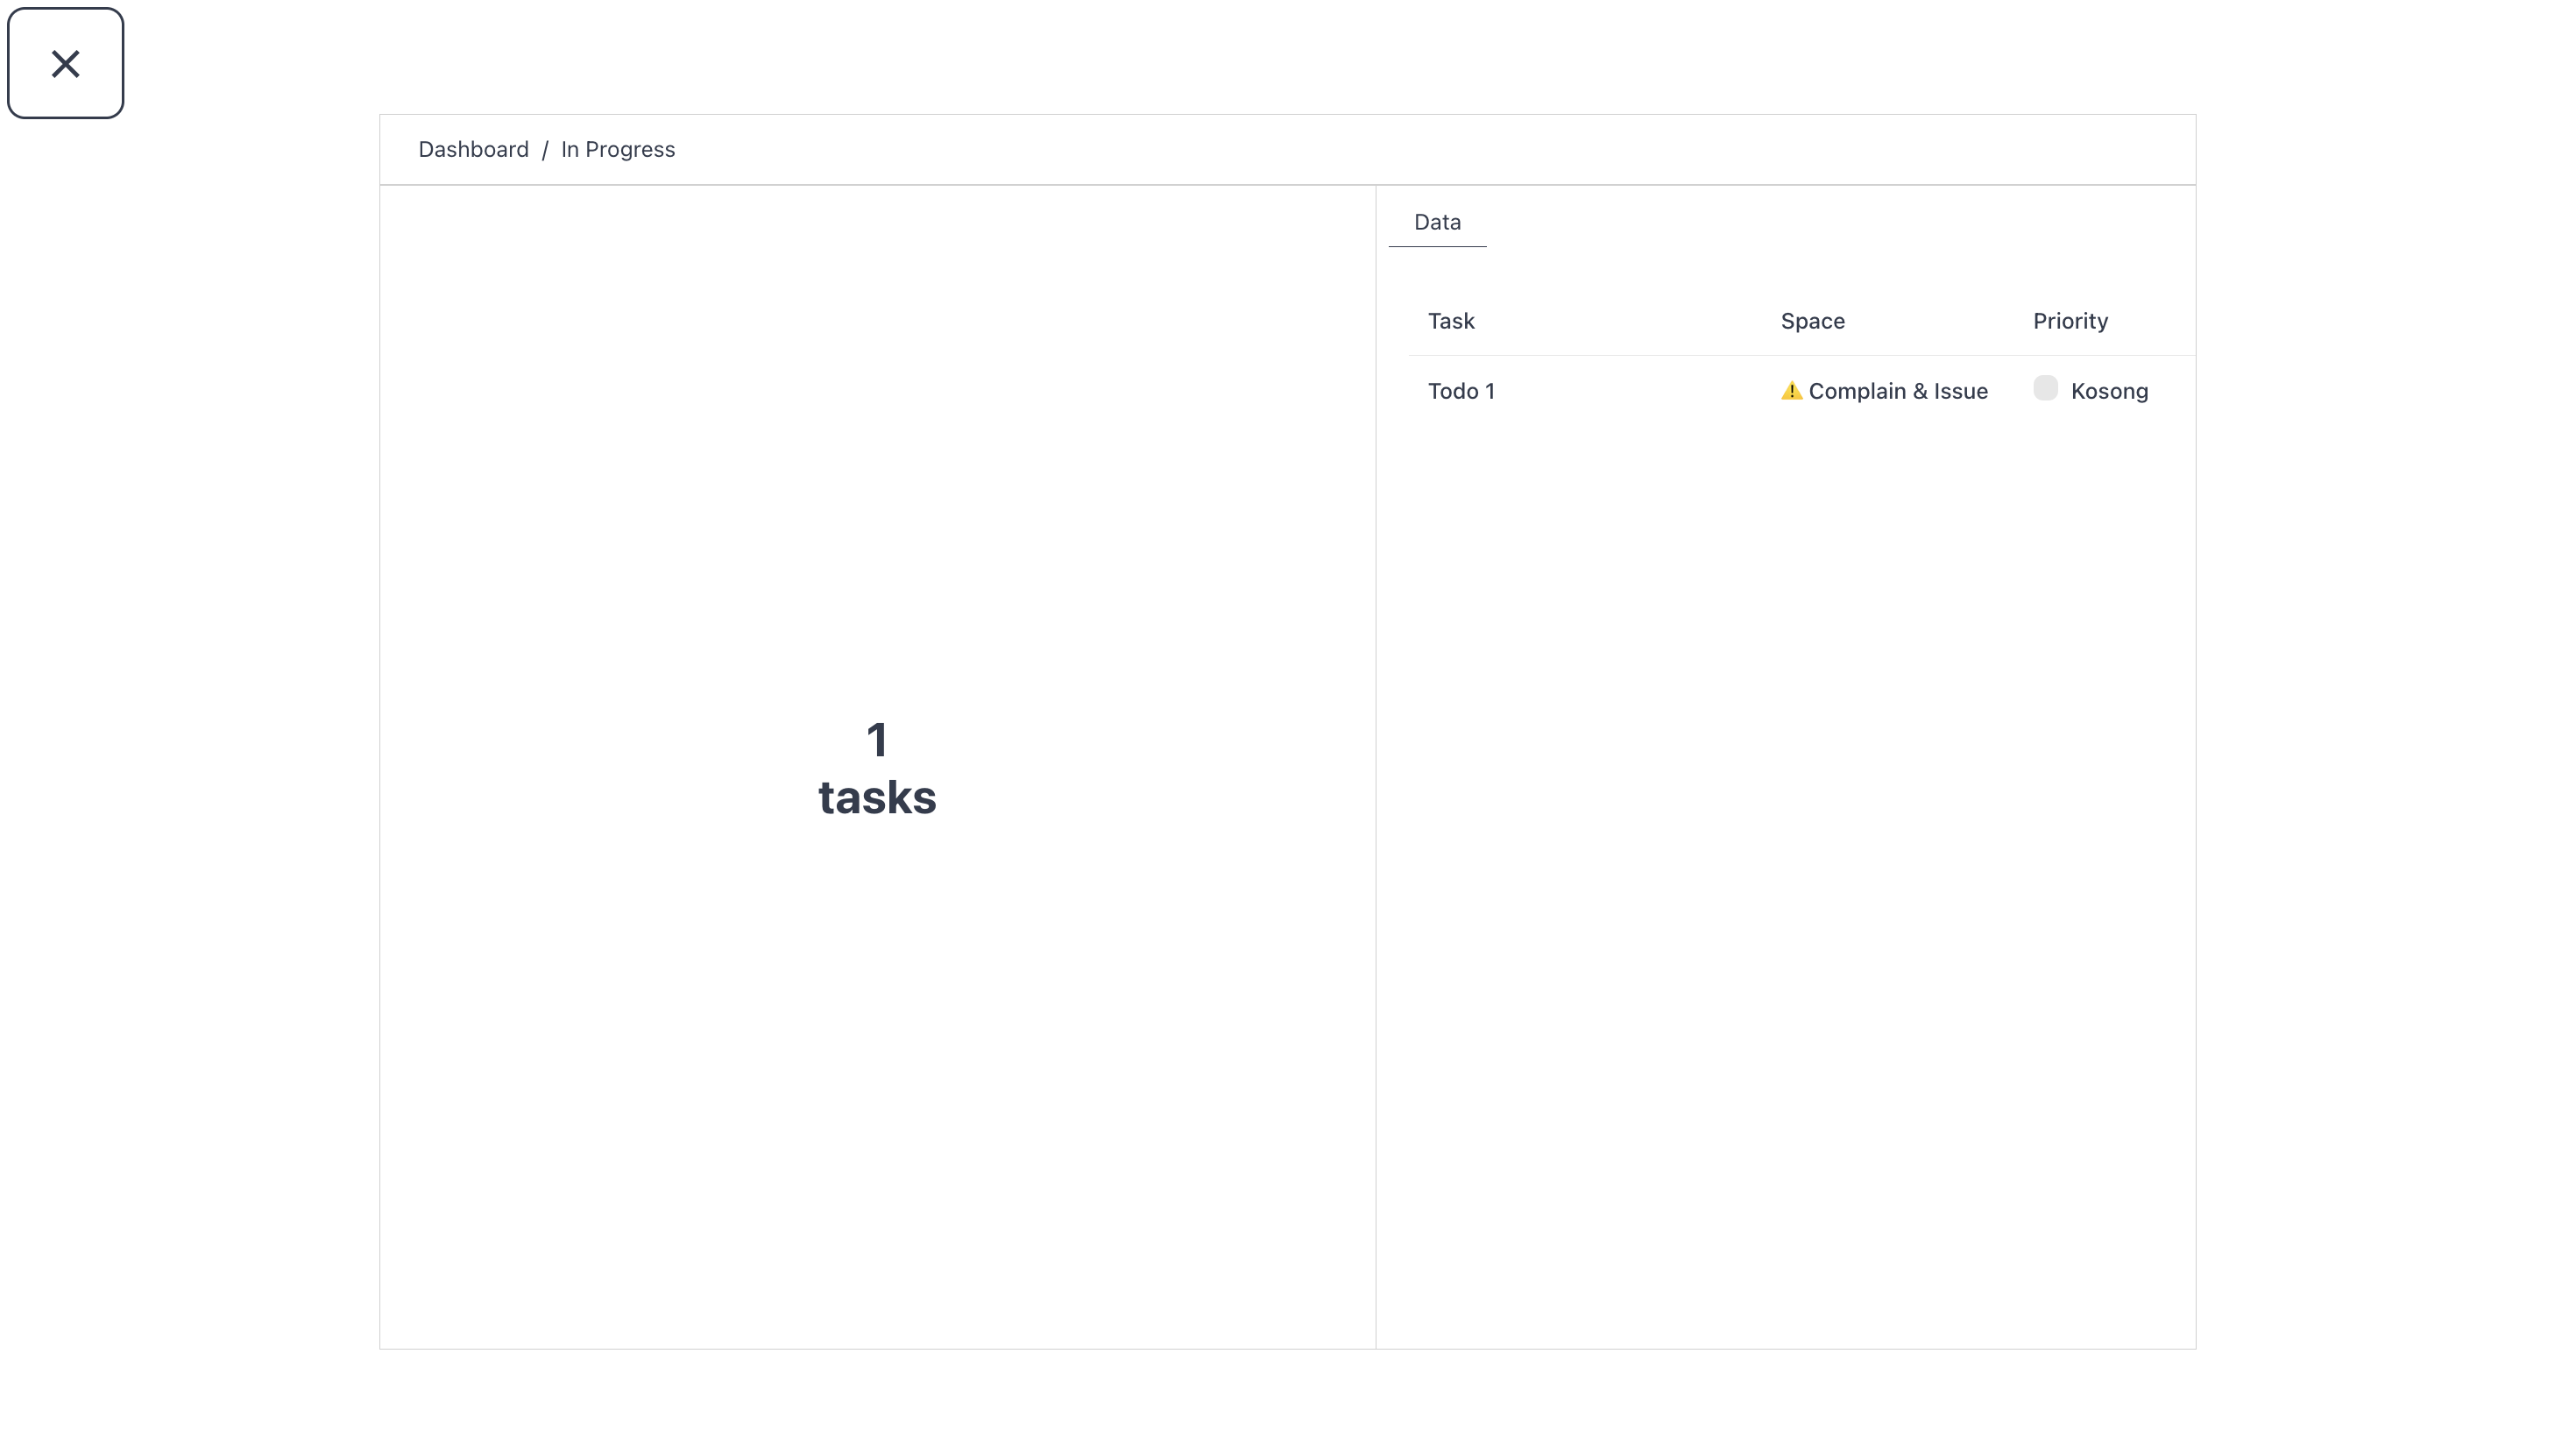
In-Progress Task counter
A counter showing how many Tasks are currently in the active type status. The "how much active work" number—when this stays high week after week, the team's plate is full.
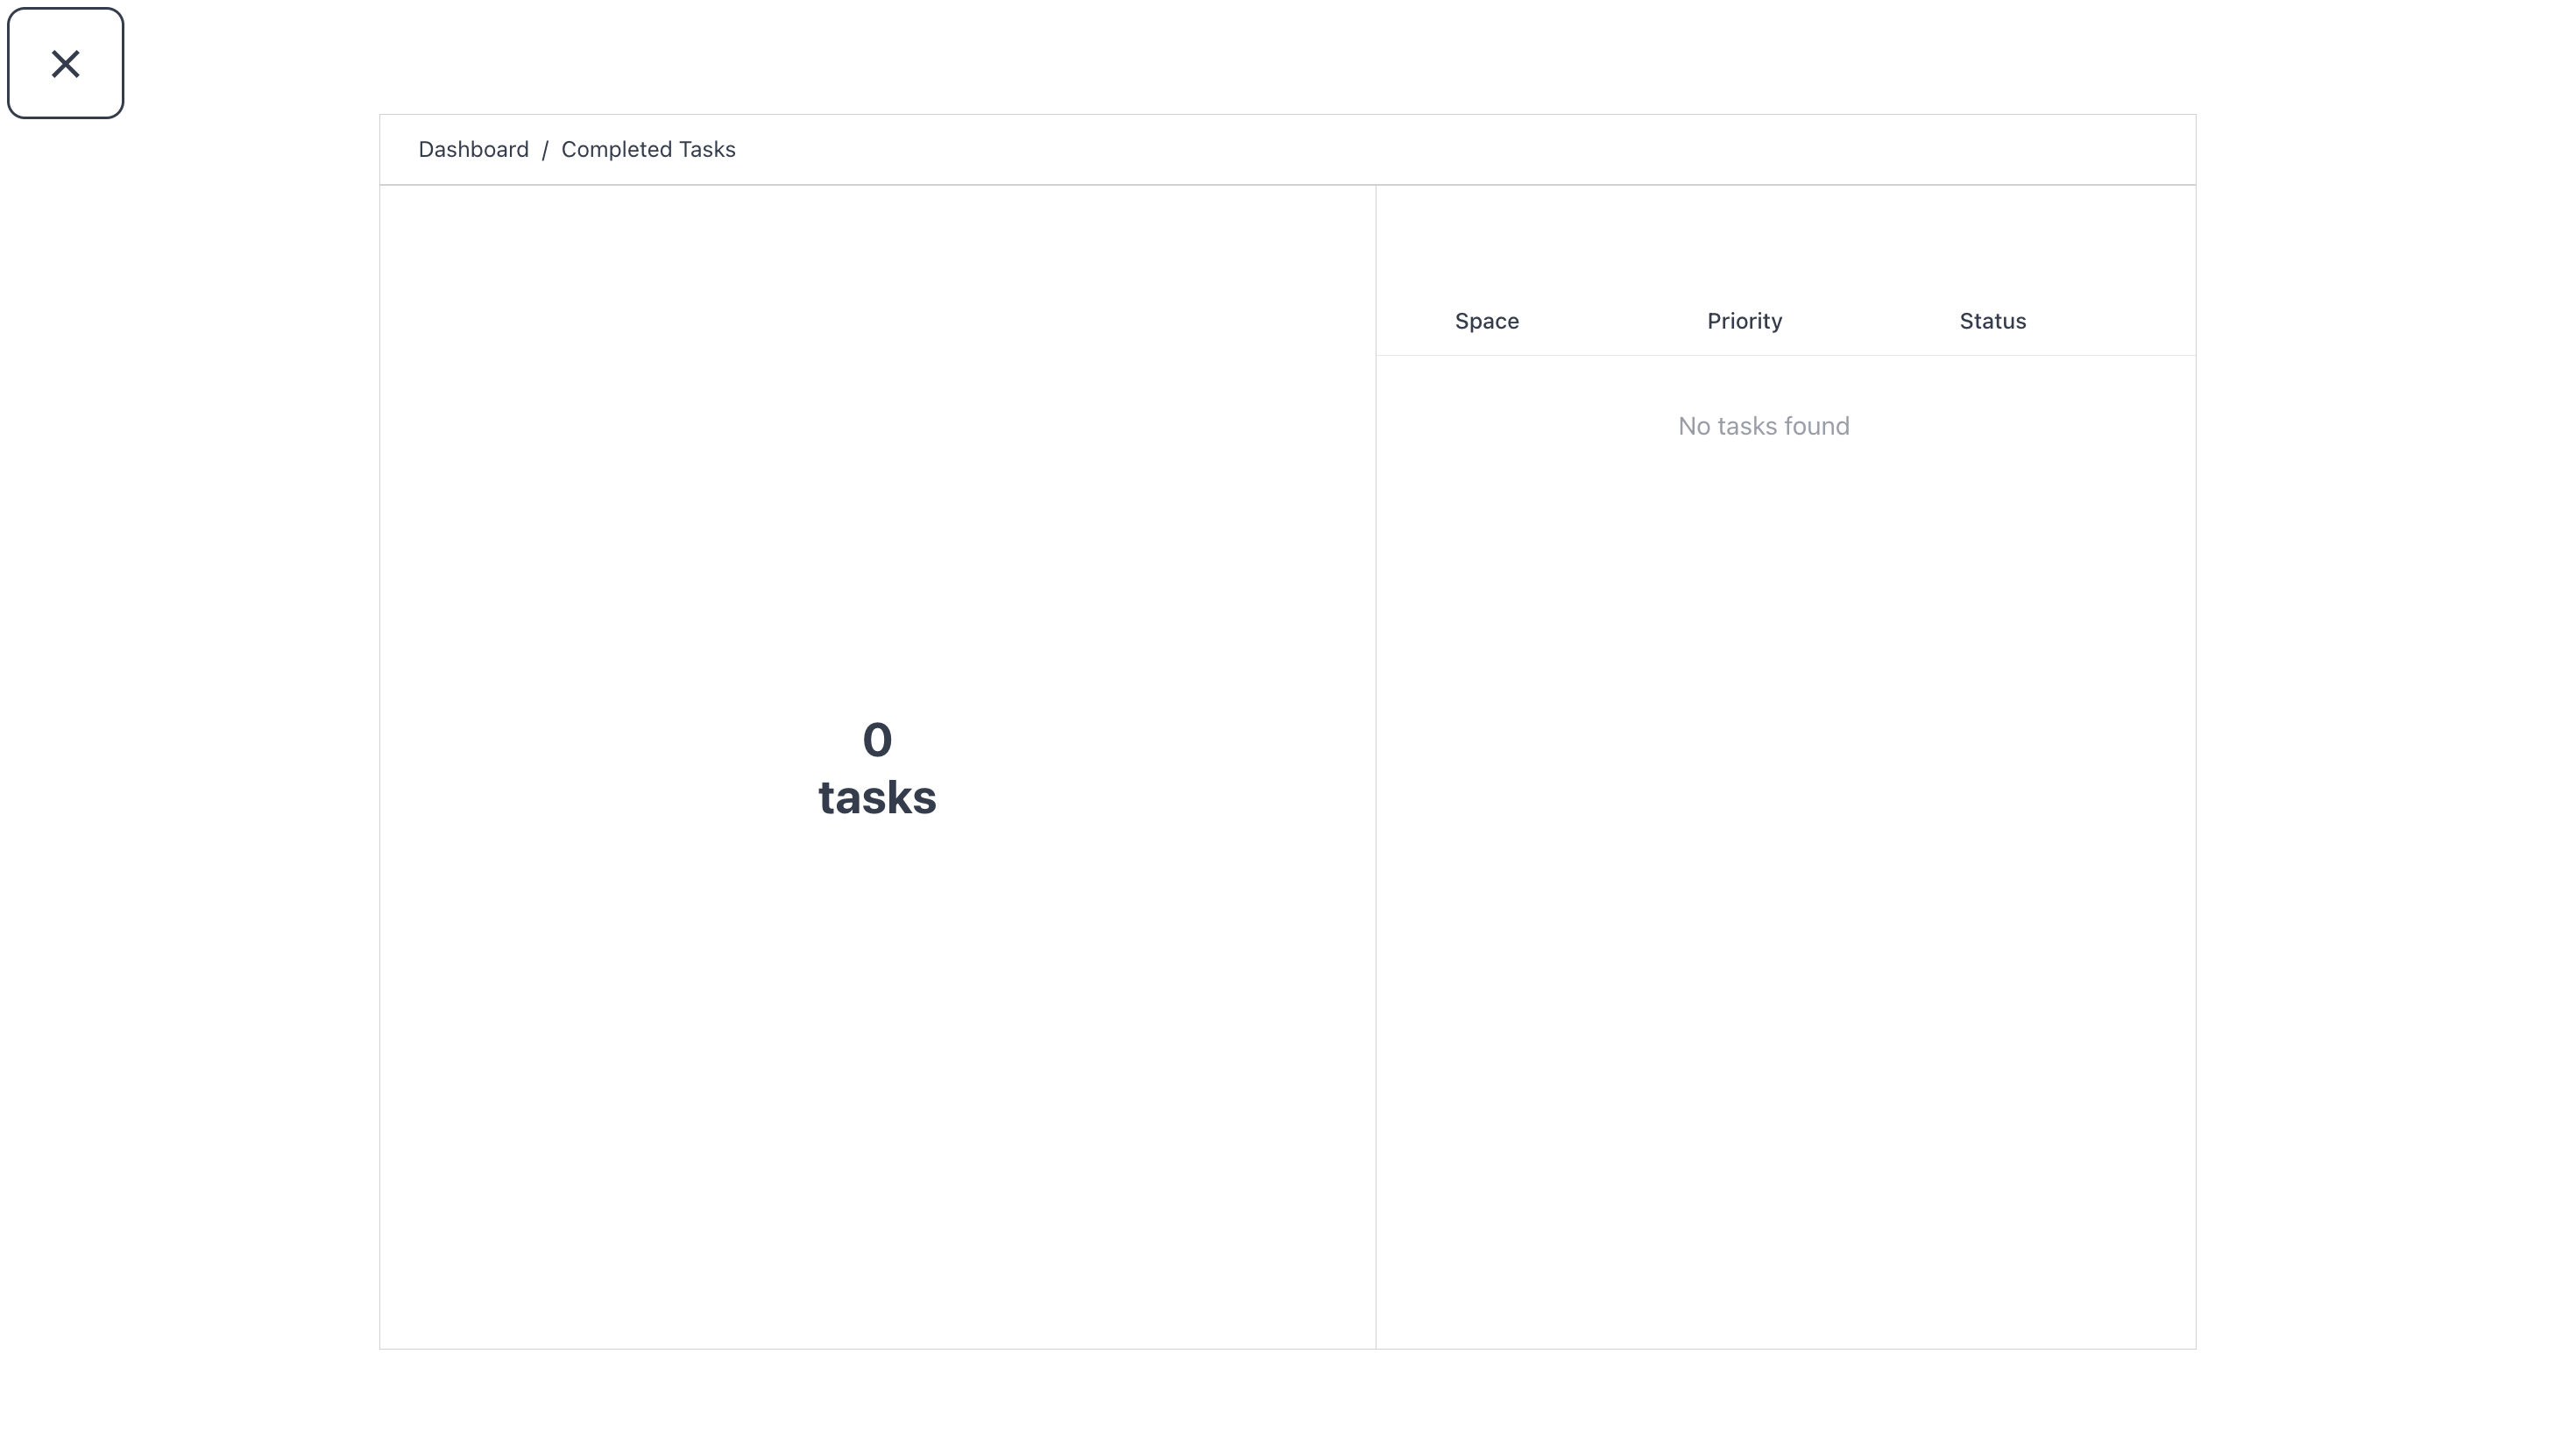
Complete Task Counter
A counter showing how many tasks are in the done type status. The "how much we've shipped" number—pair it with Total Task to see what fraction of the space is finished.
Filter the dashboard by date range
Every widget responds to the date range selector at the top of the Dashboard.
- Click the Date range dropdown at the top right of the Dashboard.
- Pick a preset (Today, This week, Last week, This month, Last 30 days, This quarter) or set a custom range.
- The widgets refresh to show data for the selected range.
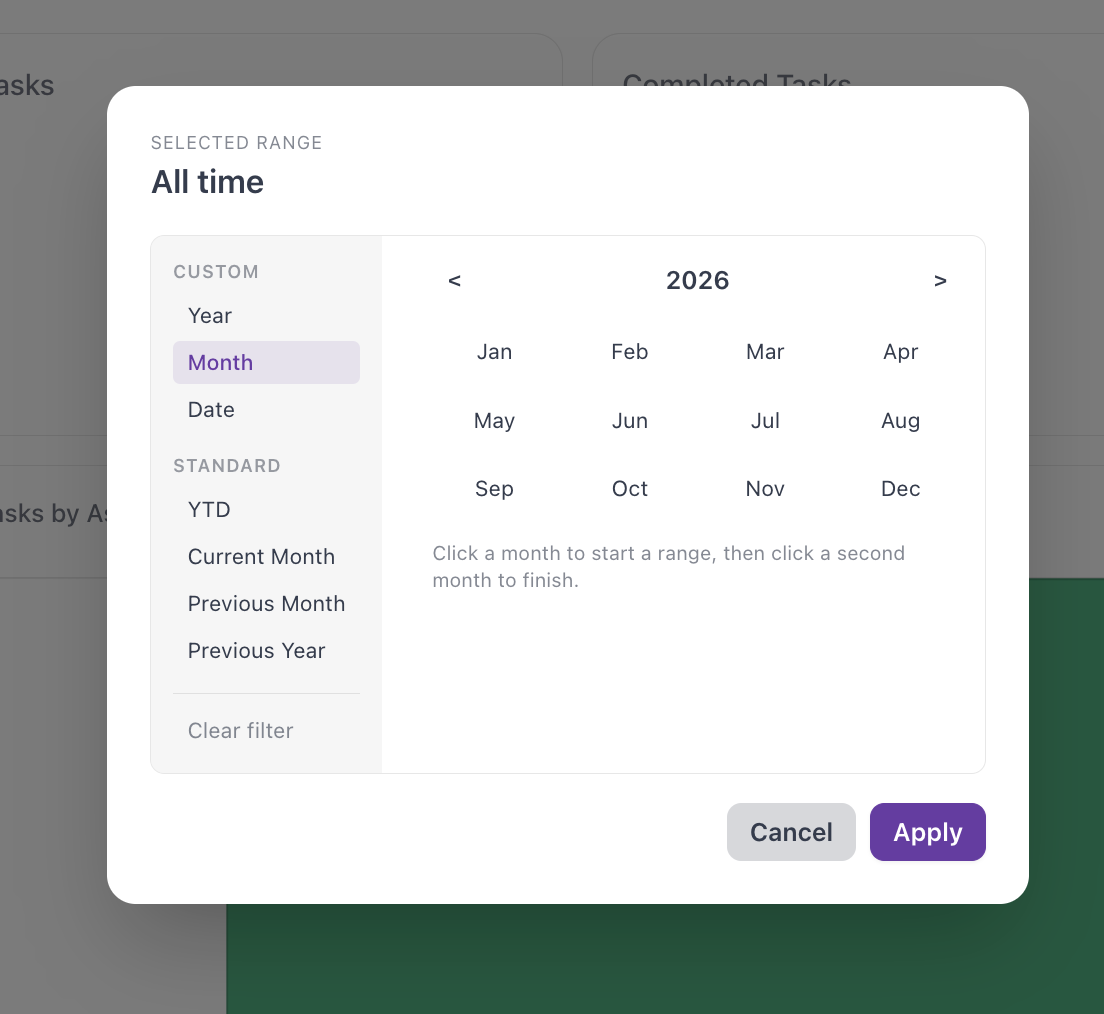
The selected range stays applied while you navigate between Dashboard widgets, so you can dig into a specific period without re-selecting it.
When to use the Dashboard
Weekly review. Pick "Last week" and walk through Total Tasks, In-Progress Task, and the Task by Status pie chart for a quick health check.
Status meeting. Open the Dashboard live in front of the team—it's faster than building slides.